Abstract
The devastating July 2026 flood in Bangladesh highlighted the critical need for rapid and accurate disaster evaluation across complex terrains. This study aims to conduct precise flood mapping to assess the spatial dynamics of the disaster across pre-flood, peak-flood, and recovery phases. Utilizing Sentinel-1 SAR imagery processed through Google Earth Engine, a time-series analysis was performed to achieve mutually exclusive land-cover classification. The spatial analysis encompasses a 17,531.95 sq km region covering the four districts of Chattogram, Bandarban, Khagrachhari, and Rangamati. The temporal assessment reveals a peak flood inundation that expanded the total surface water area by a net increase of 404.70 km². An evaluation of the land-cover impact demonstrates that agricultural zones absorbed the most severe direct damage, with cropland accounting for 332.64 km², or 82.19%, of the new floodwater. Furthermore, the post-flood waterlogging phase indicates a delayed drainage mechanism in higher elevations, leaving 280.75 km² of residual water trapped across the landscape. These quantitative insights provide a crucial data-driven framework for informed disaster management, targeted recovery operations, and resilient spatial planning.
Introduction
This project presents a spatial flood assessment for the Chittagong region using advanced satellite technology. Floods cause severe damage to communities, agriculture, and infrastructure. To accurately measure the impact of the July 2026 flood, we used Sentinel-1 SAR (Synthetic Aperture Radar) imagery. This specific satellite is highly effective for disaster monitoring because it can capture clear images of the earth's surface regardless of cloud cover or heavy rain.
The study area covers four major districts: Chittagong, Bandarban, Khagrachhari, and Rangamati. To understand the full scale of the disaster, we analyzed the region across three distinct periods: a pre-flood baseline, the peak flood stage, and a post-flood recovery stage.
By comparing these timelines, this research identifies exactly how much surface water expanded beyond permanent water bodies. The analysis maps out the exact areas of agricultural land, forests, and mountain regions that were submerged. The primary goal of this report is to provide clear, data-driven insights to evaluate the region's vulnerability and support future disaster recovery planning.
Objectives
The primary objective of this project is to accurately measure and map the spatial impact of the July 2026 flood across the Chittagong region. Specifically, the study aims to calculate the extent of new floodwater expansion and identify the areas suffering from prolonged waterlogging. A key focus is to evaluate how different land cover types, particularly agricultural lands, forests, and mountain areas, were disproportionately affected by the disaster.
To achieve these goals, the methodology relies on a time-series analysis of Sentinel-1 SAR imagery combined with ESA WorldCover data. The workflow is divided into three critical phases: establishing a pre-flood baseline of permanent water bodies, mapping the maximum inundation during the peak flood, and calculating the retained stagnant water post-flood.
By extracting the water extent for each phase and overlaying it onto land-use classifications, the project employs mutually exclusive zoning rules. This ensures that every square kilometer of damage is calculated accurately without any overlapping data. The final output provides a statistical and visual breakdown to assist in disaster response and urban planning.
Methodology and Spatial Analysis
1. Datasets and Classification Logic
To ensure our analysis is highly accurate, we combined two powerful datasets. First, we used Sentinel-1 SAR satellite imagery to detect the floodwater. Because radar can see through clouds and rain, it is the perfect tool for tracking floods. Second, we used the ESA WorldCover v200 dataset to understand what type of land was under the water.
We grouped the land into specific criteria based on their natural features: Mountain (high-elevation terrain), Forest (areas covered with dense trees), Cropland (agricultural farming zones), Urban (built-up areas like roads and buildings), and Others (open spaces and riverbanks).
To avoid any errors, we applied a Mutually Exclusive Classification Rule. This means if a specific piece of land is counted as "Water," it cannot be counted as "Forest" or "Cropland" at the same time. This strict rule ensures that every single square kilometer of our 17,531.95 sq km study area is counted exactly once, giving us 100% accurate results.
2. Pre-Flood: Establishing the Baseline
Before analyzing the flood, we needed to know how much water is normally present in the region. Using imagery from late June to early July 2026, we mapped the permanent water bodies, such as rivers and the Kaptai Lake. This "Pre-Flood Baseline" gave us a starting water area of 608.64 sq km. Any water we detect beyond this baseline during the disaster will be counted as actual floodwater.
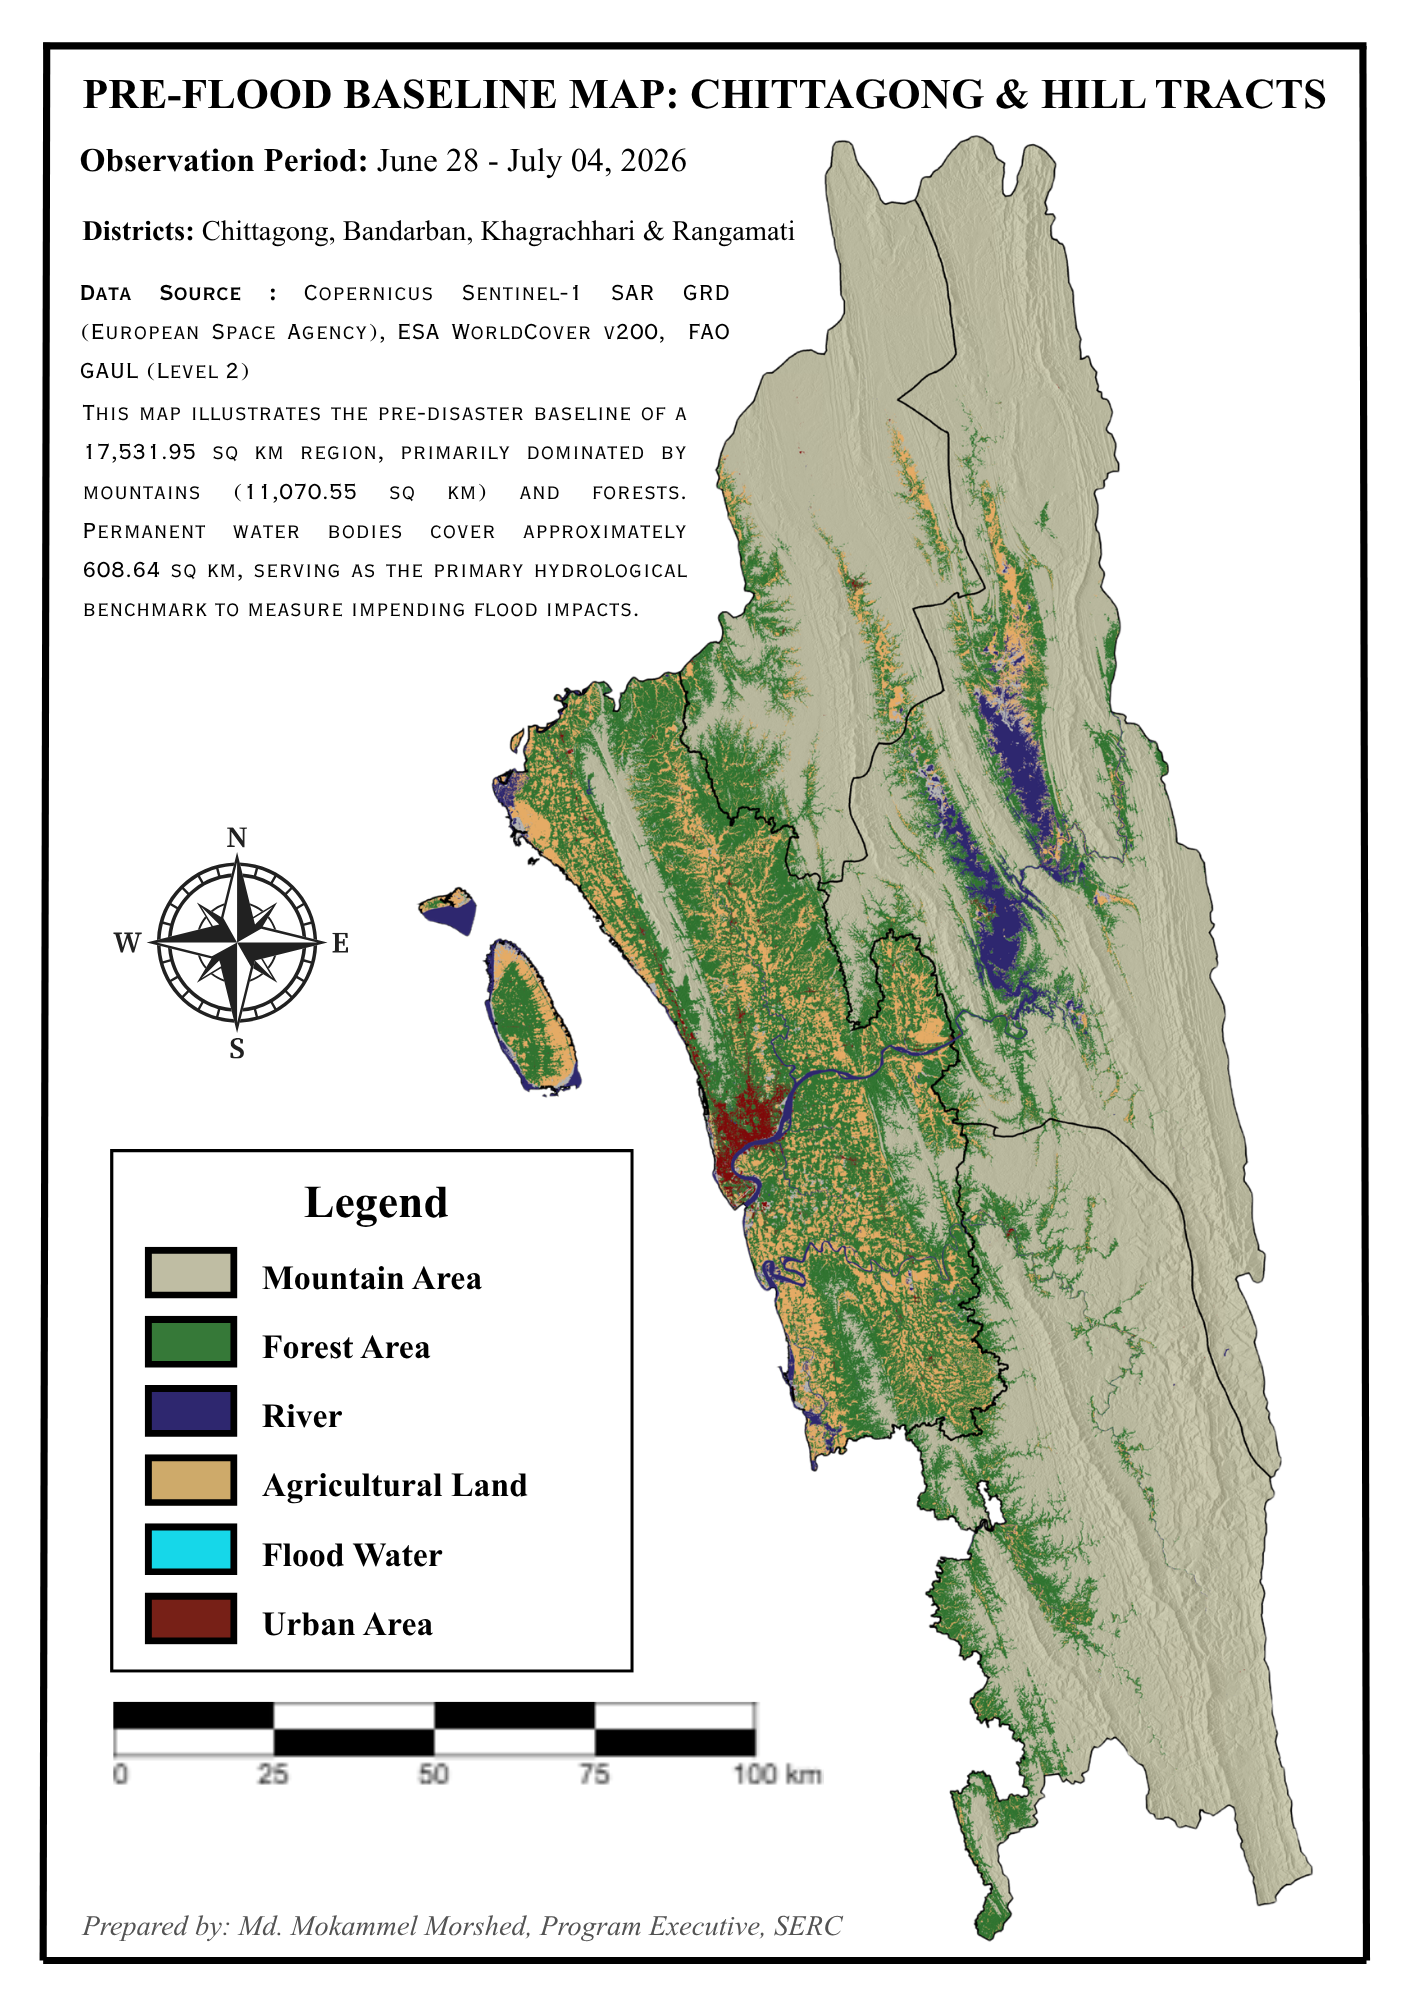
| Land-Cover Class | Area (sq km) | Status |
|---|---|---|
| Mountain Area | 11,070.55 | Normal |
| Forest Area | 3,915.98 | Normal |
| Cropland | 1,573.84 | Normal |
| Permanent Water | 608.64 | Baseline Reference |
| Urban Area | 144.30 | Normal |
3. During Flood: The Peak Impact
As the heavy rains continued into mid-July, the rivers overflowed. During the peak of the flood, the total water area expanded dramatically to 1,013.34 sq km. This means 404.70 sq km of new land was completely swallowed by water.
When we analyzed where this new water went, the results were clear: the croplands took the hardest hit. Because agricultural lands are mostly flat and located near rivers, they acted like a sponge, absorbing more than 82% of the overflow.
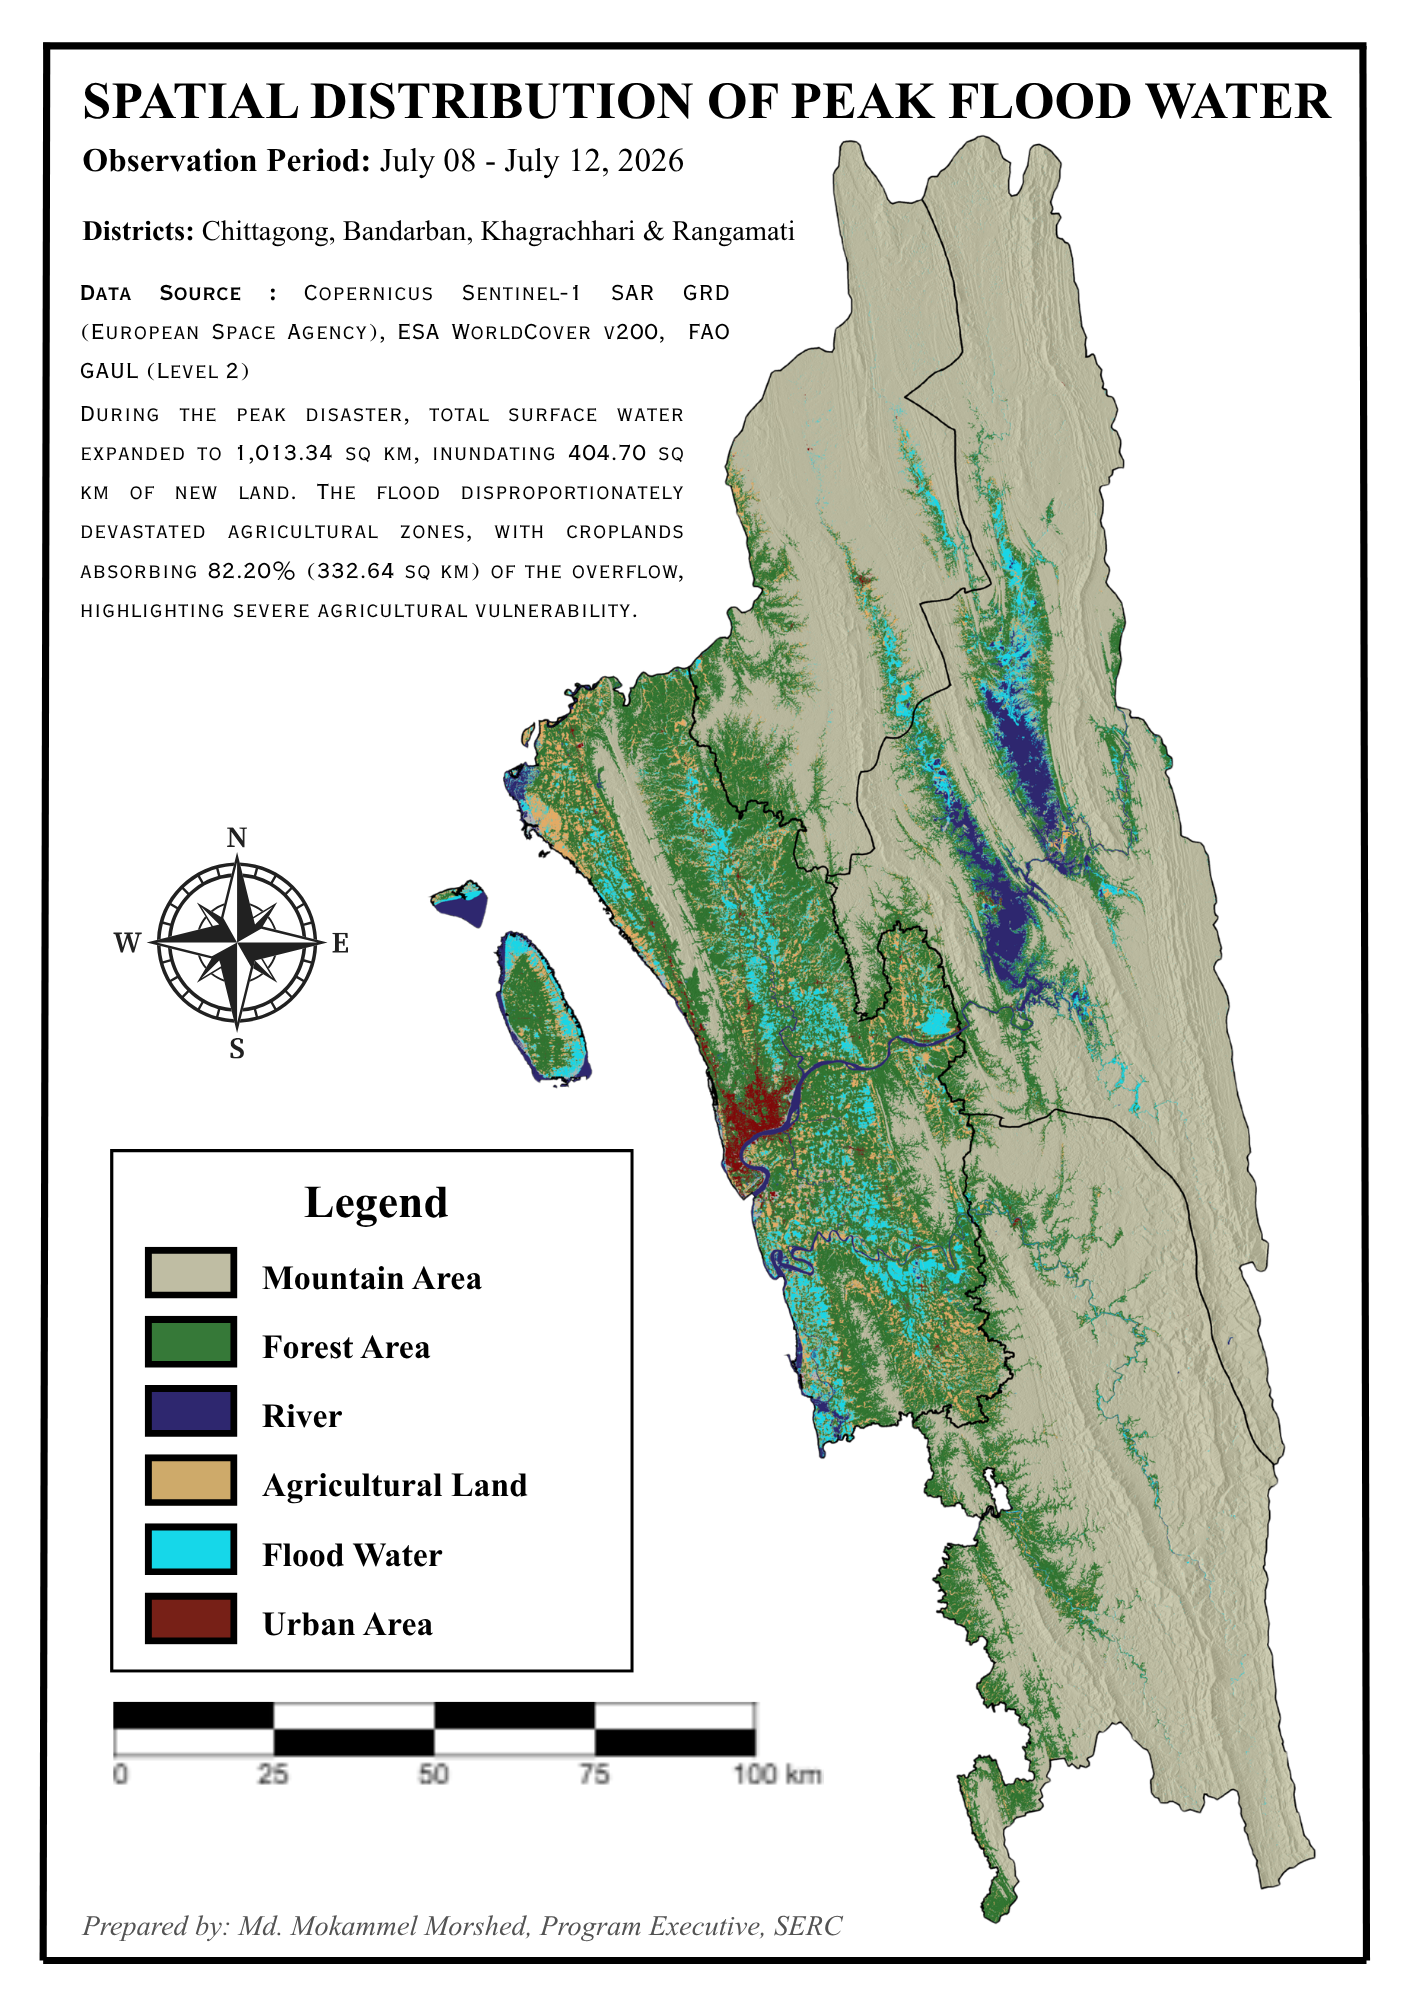
| Source Zone | Converted to Water (sq km) | Share of Total Damage |
|---|---|---|
| Cropland | 332.64 | 82.19% |
| Others (Riverbanks) | 53.51 | 13.22% |
| Forest | 16.49 | 4.08% |
| Mountain | 2.02 | 0.50% |
Visual Breakdown of Flooded Zones:
4. Post-Flood: Water Retention and Recovery
By late July, the floodwaters slowly began to recede, dropping the total water area to 889.39 sq km. However, this means that 280.75 sq km of stagnant floodwater remained trapped on the land. While the croplands started to drain out and recover, a surprising event happened in the higher areas.
Because the water from the top of the mountains takes time to flow down into the valleys, the forest and mountain regions actually saw an increase in waterlogging during this post-flood stage. This delayed flooding is a major challenge for the region's recovery.
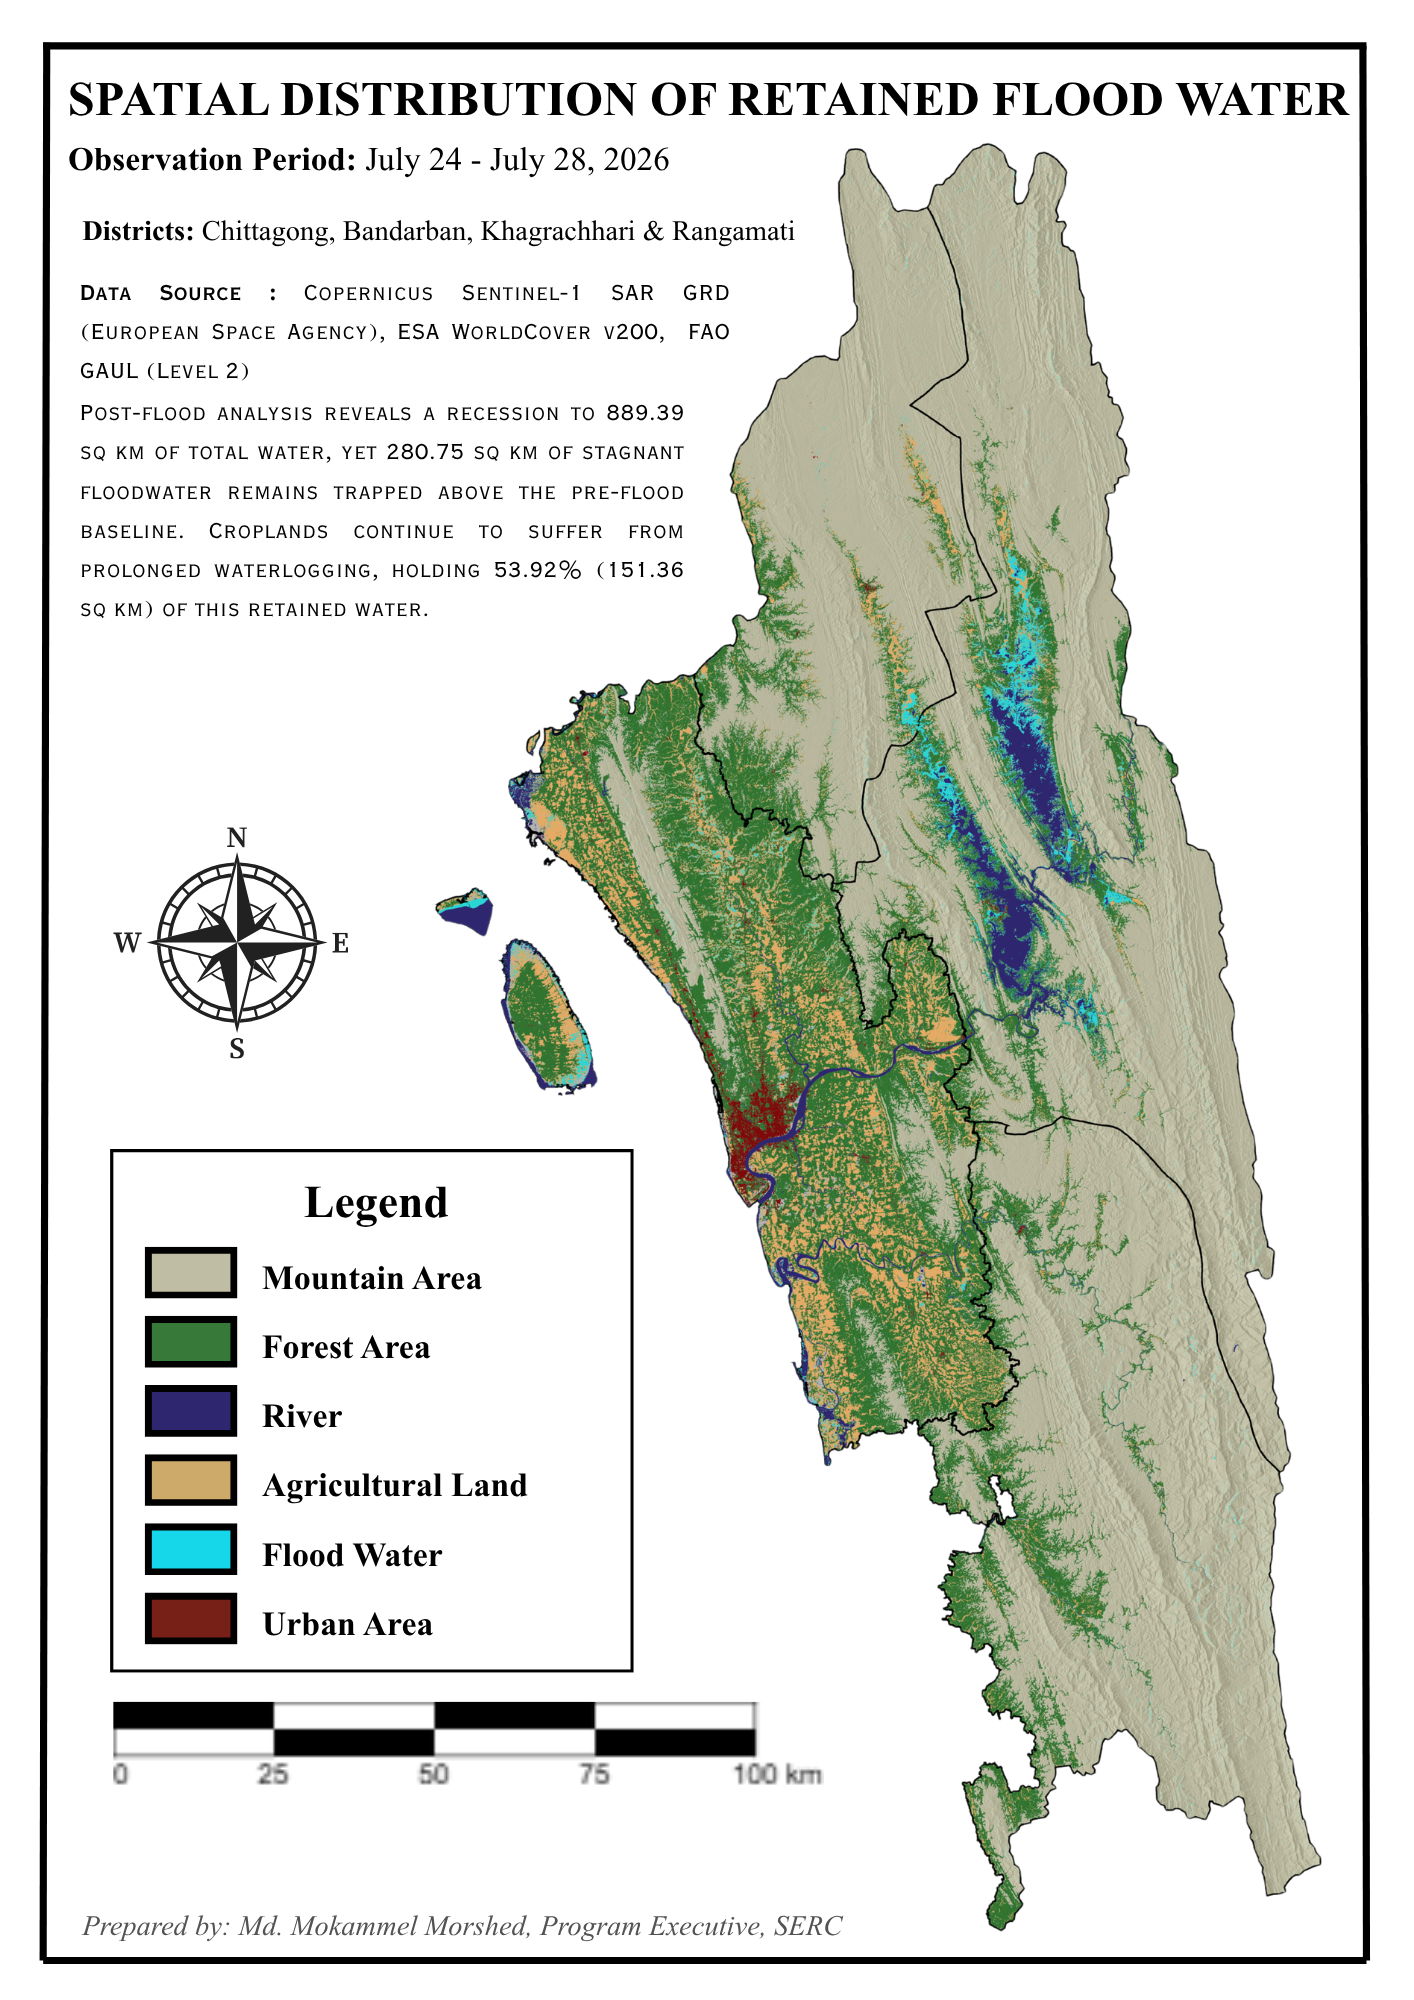
| Source Zone | Still Under Water (sq km) | Recovery Status |
|---|---|---|
| Cropland | 151.36 | Recovering (Draining out) |
| Others (Riverbanks) | 68.18 | Still Rising |
| Mountain Area | 30.96 | Still Rising (Delayed flow) |
| Forest Area | 29.27 | Still Rising (Delayed flow) |
5. Comparative Analysis
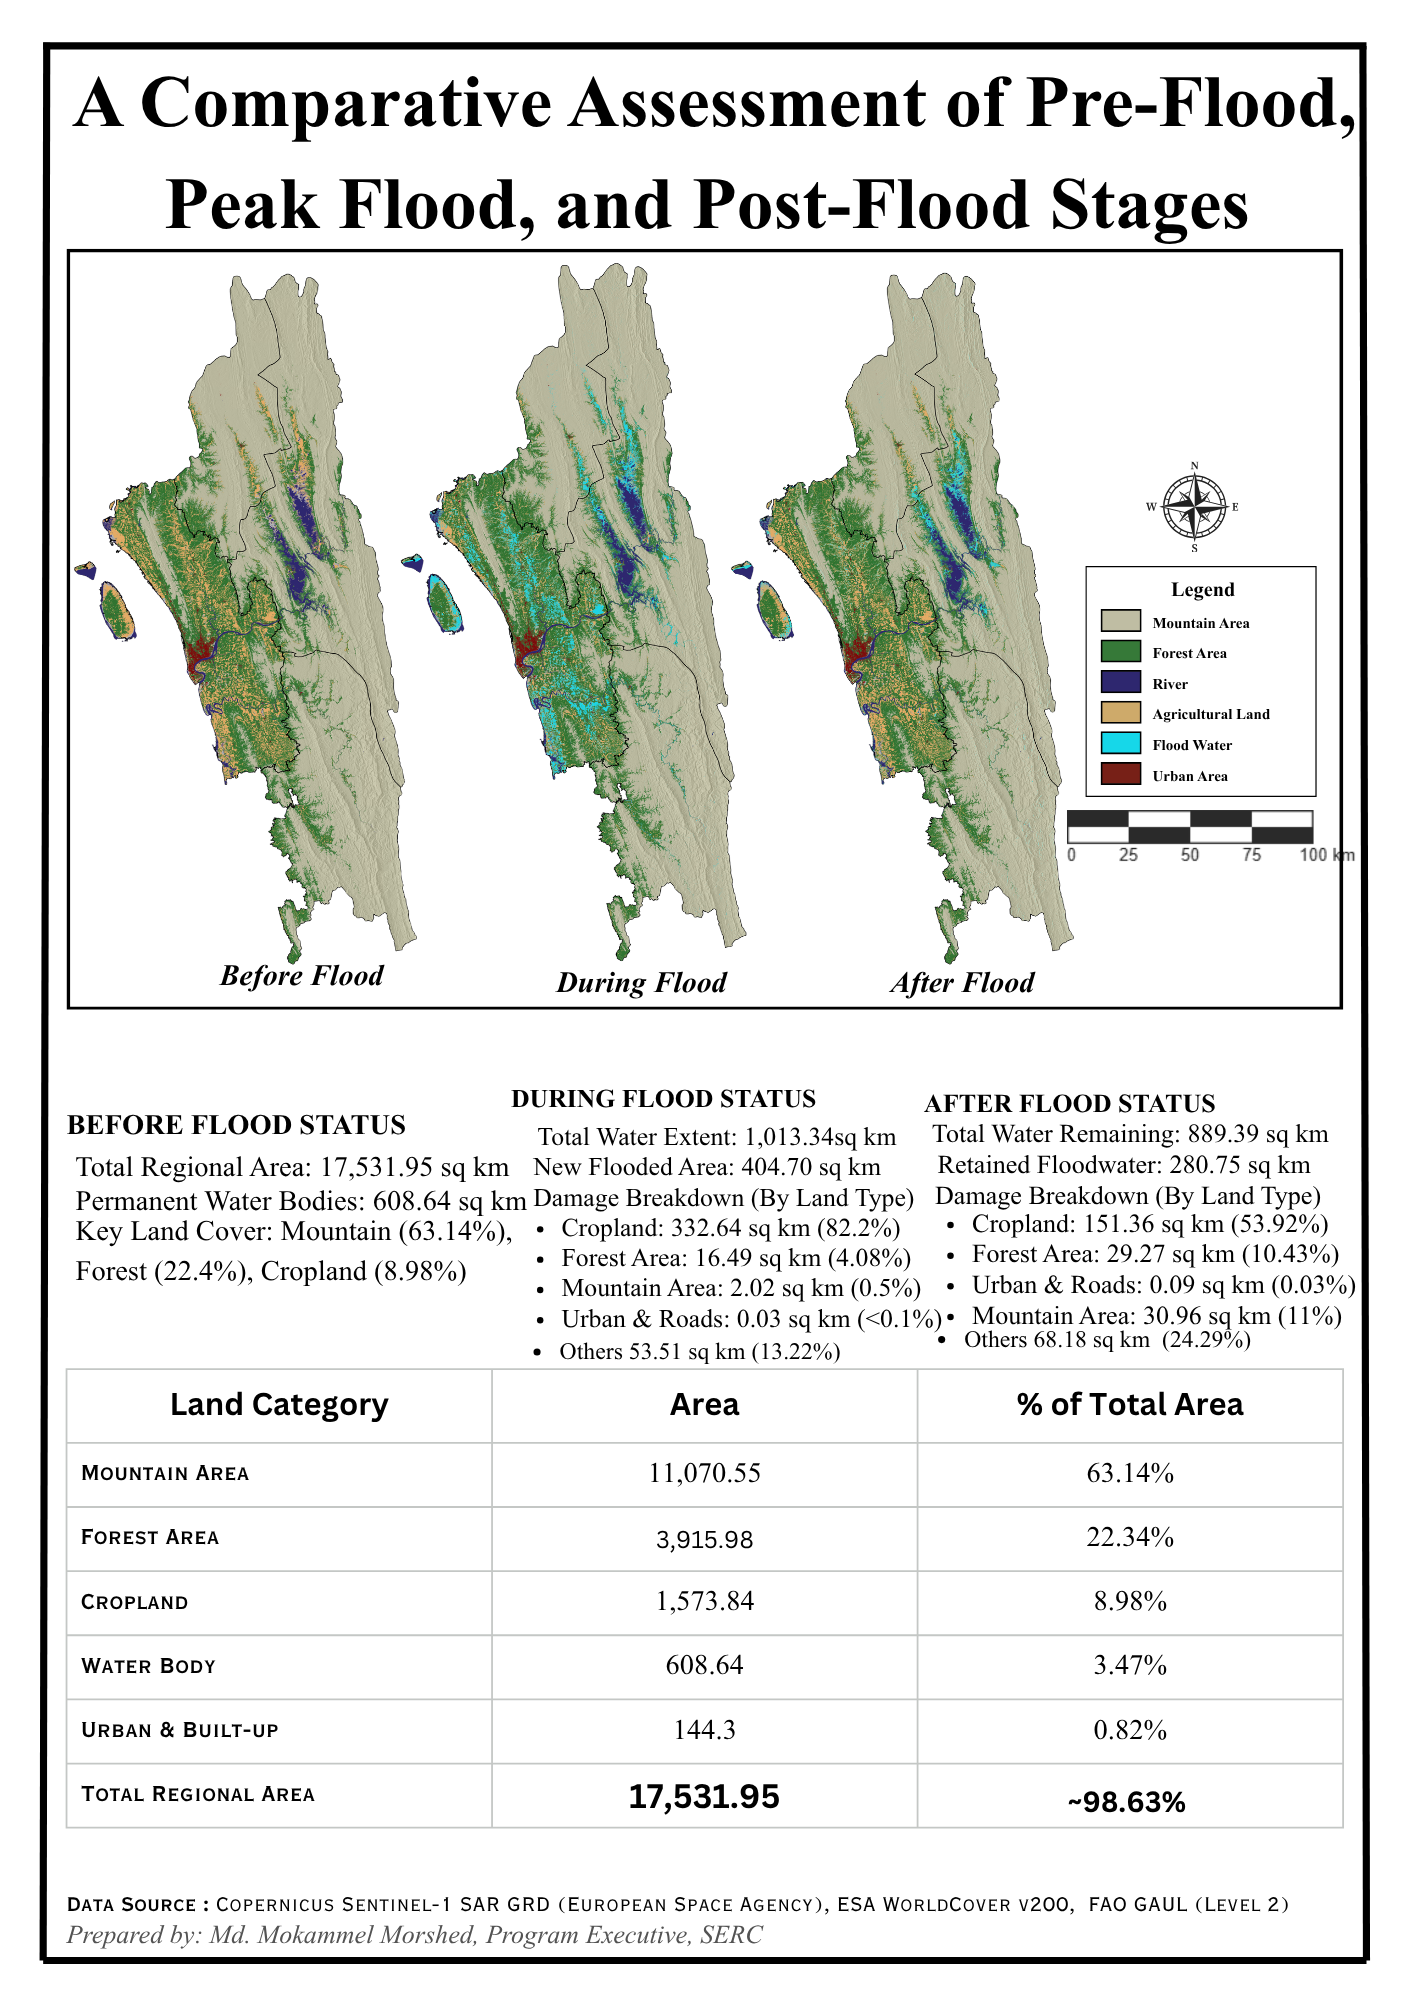
When we look at the whole timeline side by side, a clear pattern emerges. The flood's impact on agricultural lands was incredibly severe but short-lived, as the water quickly drained away. In contrast, the valleys in the mountainous and forested areas suffered from long-lasting waterlogging. Understanding this dynamic is crucial for disaster management teams to know exactly where to send help first, and where the danger will linger the longest.
Key Findings
- 404.70 km² of New Inundation: Sentinel-1 SAR analysis identified 404.70 km² of newly inundated area during the peak flood stage compared with the pre-flood baseline.
- 332.64 km² of Cropland Affected: Cropland accounted for 332.64 km² of the newly inundated area, representing the largest affected land-cover category.
- 82.19% of New Inundation Occurred on Cropland: Cropland represented 82.19% of the total new floodwater expansion detected during the peak flood period.
- 280.75 km² of Residual Water: Post-flood analysis detected 280.75 km² of residual water, indicating substantial persistence of inundation after the peak event.
- Delayed Waterlogging in Higher Terrain: While cropland areas showed signs of drainage, forest and mountain zones exhibited persistent or increasing waterlogging during the post-flood stage.

